AD/FIN
Seeing through the Financial Fog.
AD/FIN brought finance industry quality intelligence to advertising programmatic media markets.
As the lead designer, I restructured the information on our data portal and created data visualizations to provide meaningful, accurate, and efficient insights.
Challenges
- Strategic: Programmatic media was becoming a major method to purchasing online ad inventory, but the supply chain is convoluted and opaque.
- Tactical: Current data portal was a disjointed accumulation of work by multiple designers.
Solutions
- Bring transparency through data analytics and visualizations.
- Bring attention to bad spending and guide towards optimal spending.
Users
- CMOs and brand marketing managers who need a clear picture of their budget spend
Results
- Visualized billions of data points for large corporations, such as Association of National Advertisers (ANA), Accenture, and more.
- Helped create a groundbreaking report that could affect billions of dollars in ad spending.
Project 1
Information Architecture
When I first worked on AD/FIN, it was a platform with multiple disparate portals in different layouts and systems created by various designers.


Persona
I studied the applications to look for a common navigation structure by creating a wireflow site map. There are many unexpected links in unexpected places.
I was asked to consolidate the websites and make the site more "user friendly". My solution is to lead and devise a consistent information architecture and design system to reorganize the current pages and future features according to our users' workflow.
I helped the company to steer away from being driven only by business goals but also user goals, by introducing user research such as collecting user stories and creating user personas.
Primary User:
Brand Marketing Manager
ROLES
- Monitor ad campaign progress Approve agencies and media plans
GOALS
- Understand budget allocation across completed campaigns
- Single campaigns only if they need to investigate
- Compare individual campaigns to group benchmarks
- Monitor budget allocation of ongoing campaigns
- Understand where the company stands compared to industry benchmarks
MOTIVATIONS
- Cut costs on unnecessary expenses (tech fees)
- Observe campaign progress and predict the best ad buys
frustrations
- Lack of clear picture of where money was spent
- Lack of integrated tool across all ad media
TECHNOLOGY SKILLS
- Proficient in basic office software
- Experience in other ad consoles
Navigation
We then reorganized our navigation according to the users' most common workflow, and reduced the header so that the focus of each page is the key data visualization.
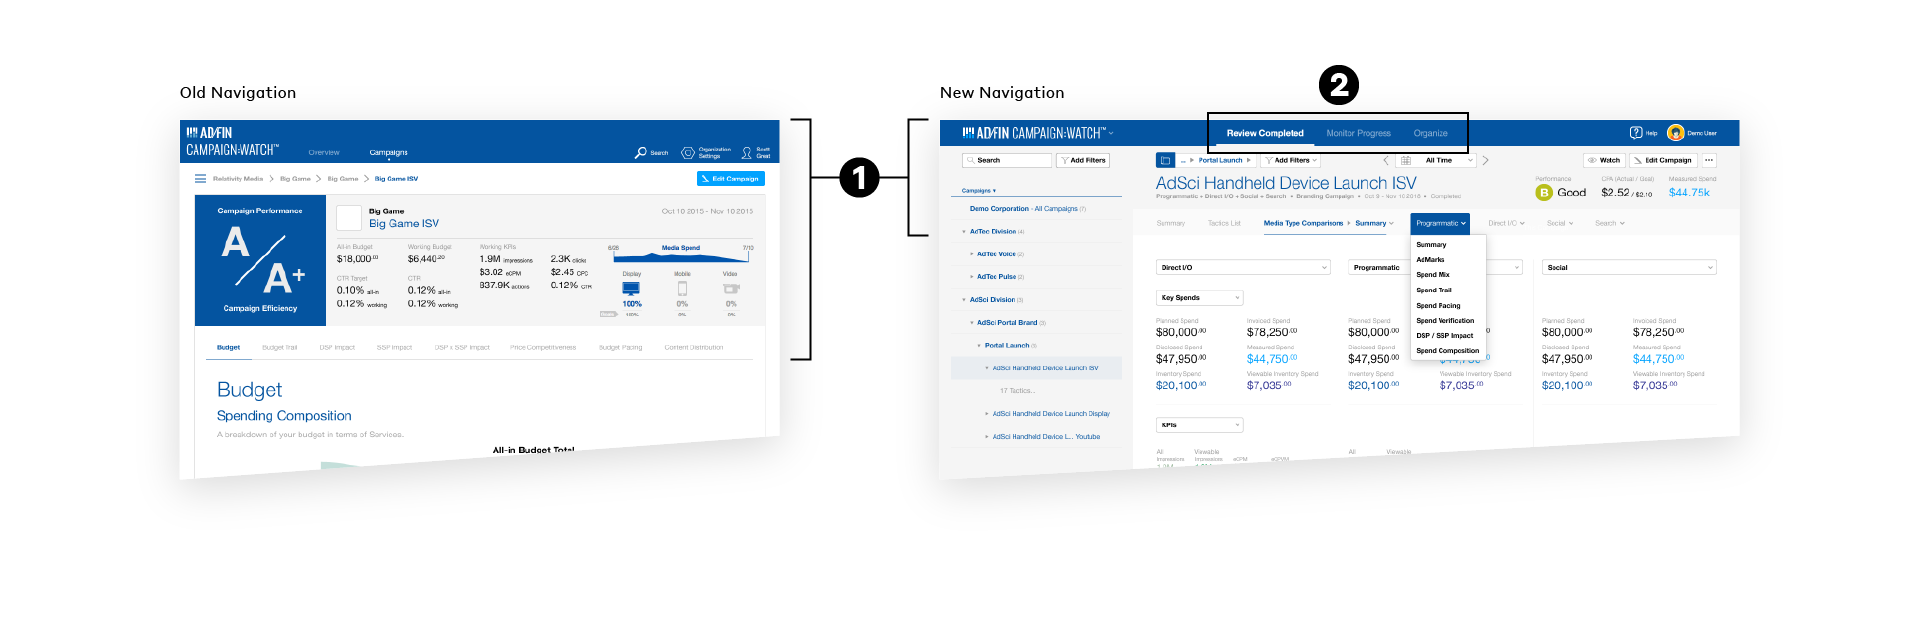
Information Hierarchy
Each page is structured with 2 to 3 data visualizations of the same topic with varying levels of efficiency and accuracy, allowing users to spot the key insight at a glance and then deep dive to inspect, analyze, compare, and predict.
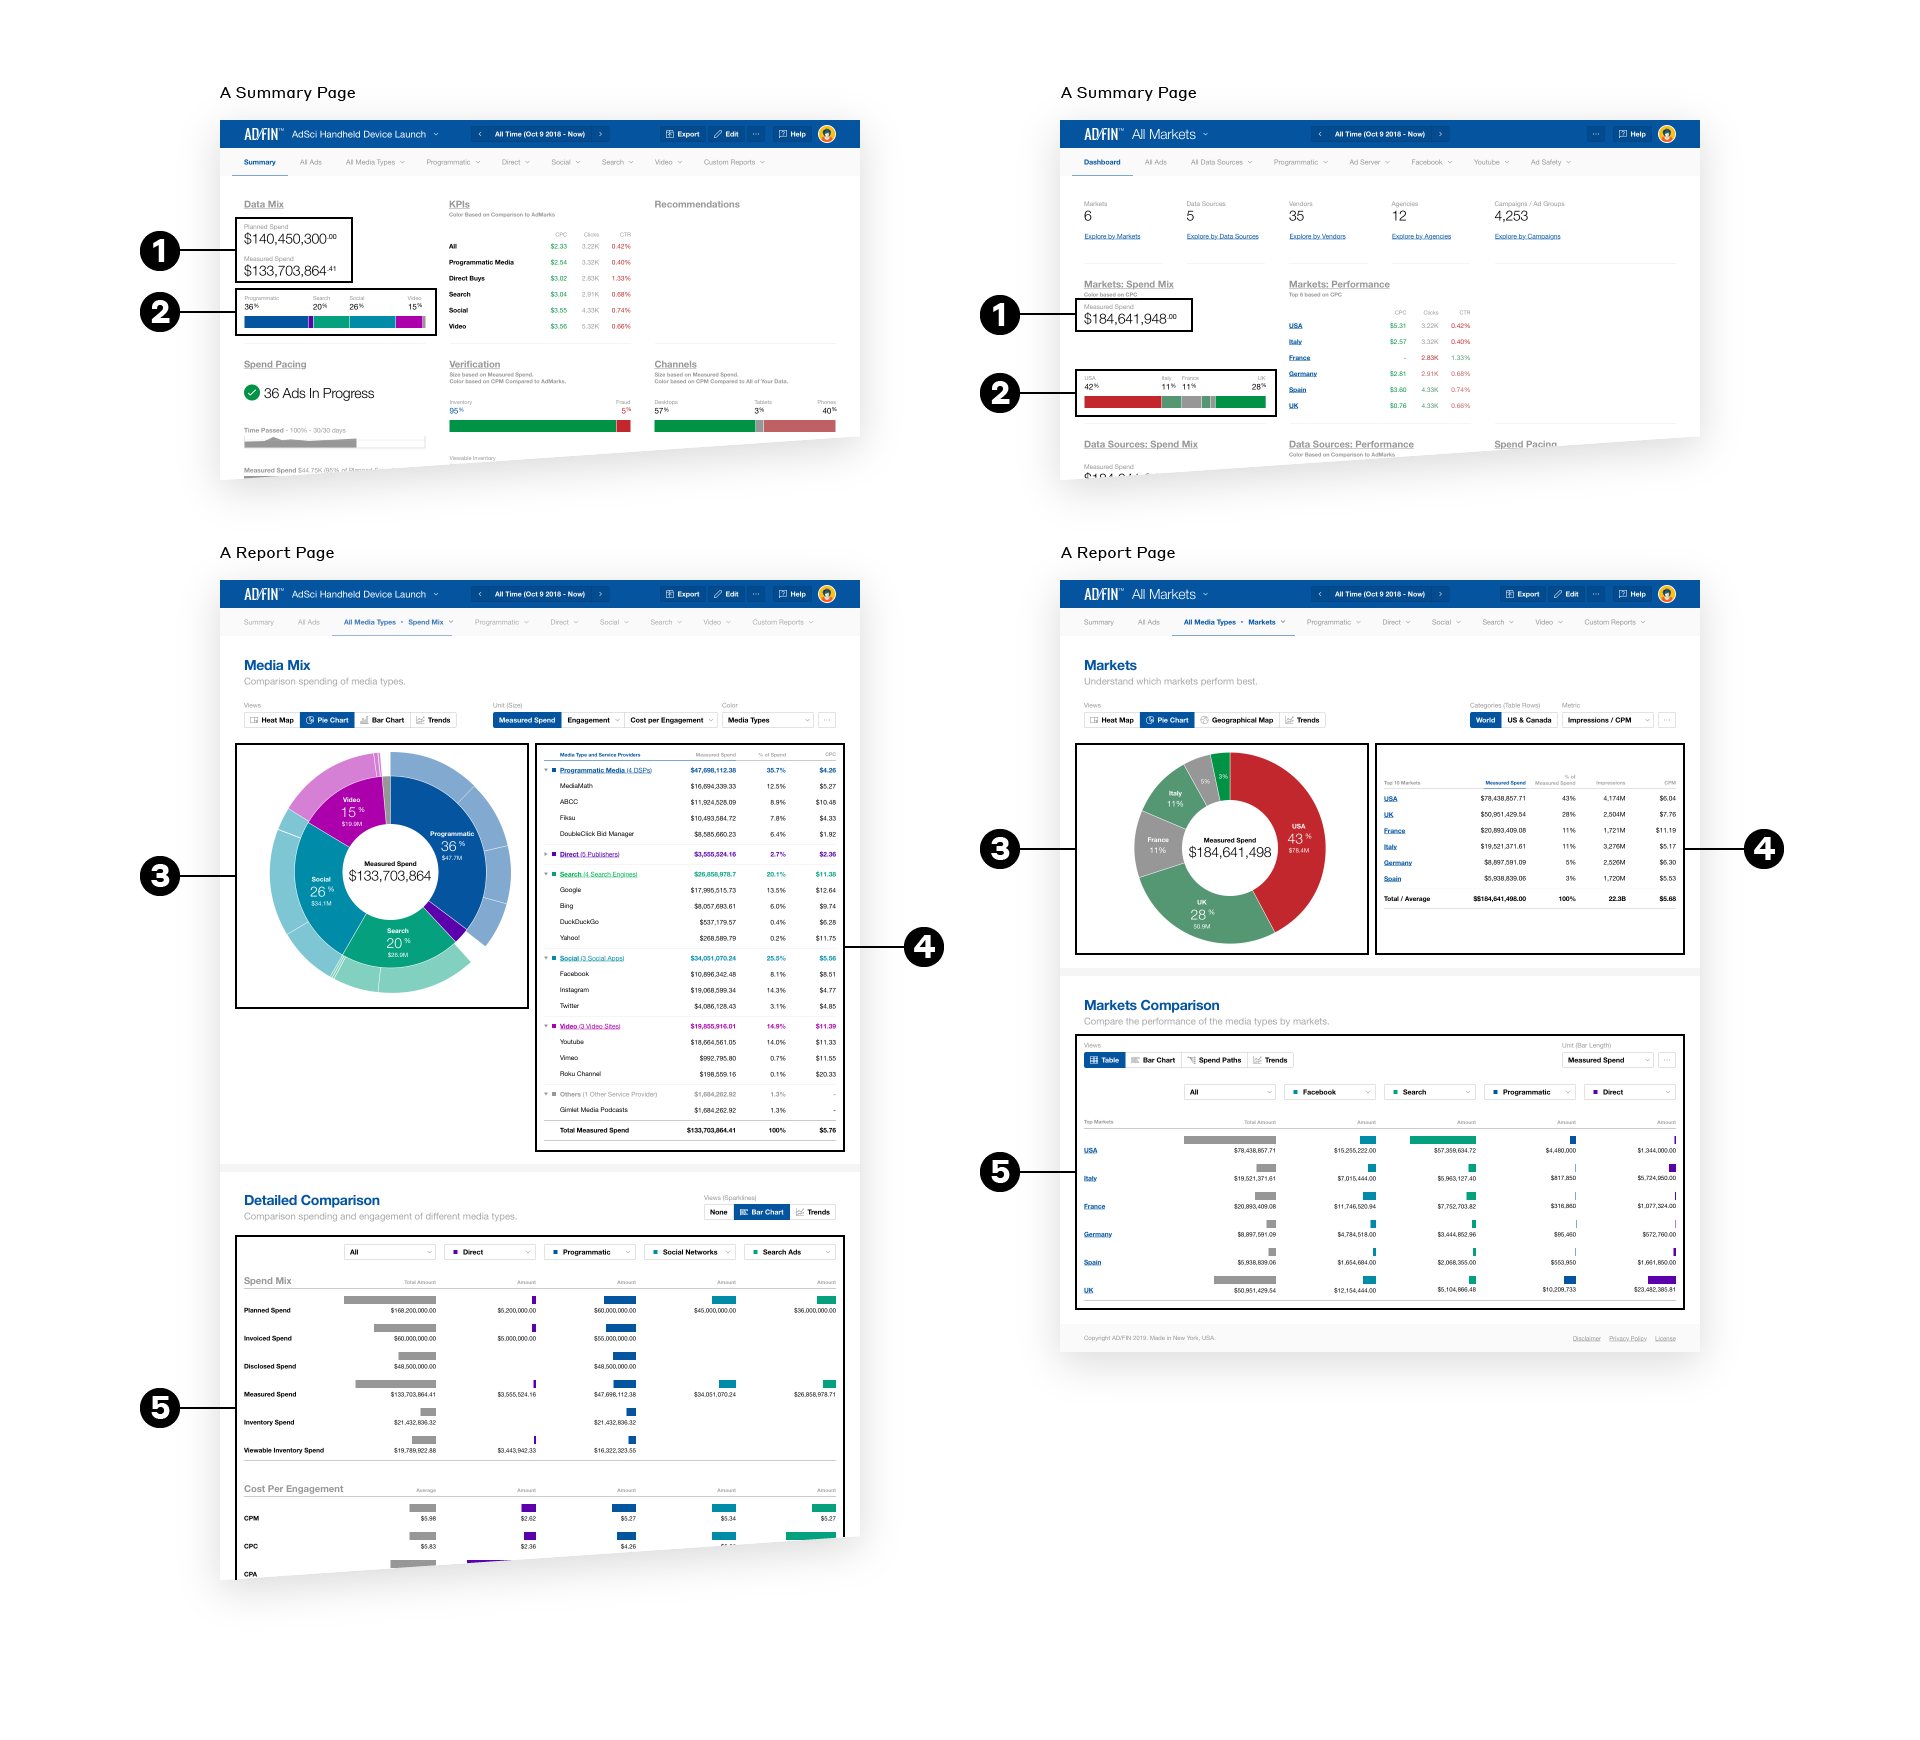
Site Map and Catalog
We catalogued every data visualizations we had created. The site was reorganized by each visualization's purpose, and each page was organized by each visualization's fidelity.


Dashboard
Since each data visualization was then modularized, its key insights could fit on the dashboard that users can customize and visit upon login.

Design System
We created a standard set of UI elements in Sketch that is consistent throughout the website, and allowed our developers to style the React components accordingly with Zeplin.

Project 2
Data Visualization
The supply chain of programmatic media advertising is complicated, making it hard for advertisers to keep track of their budget.

AD/FIN had created an advanced data analysis platform that can ingest billion points of data generated by the log files of the advertising services.

Examples
Each visualization is designed with 4 key attribute in minds: insightfulness, data accuracy, fidelity, and visual harmony.


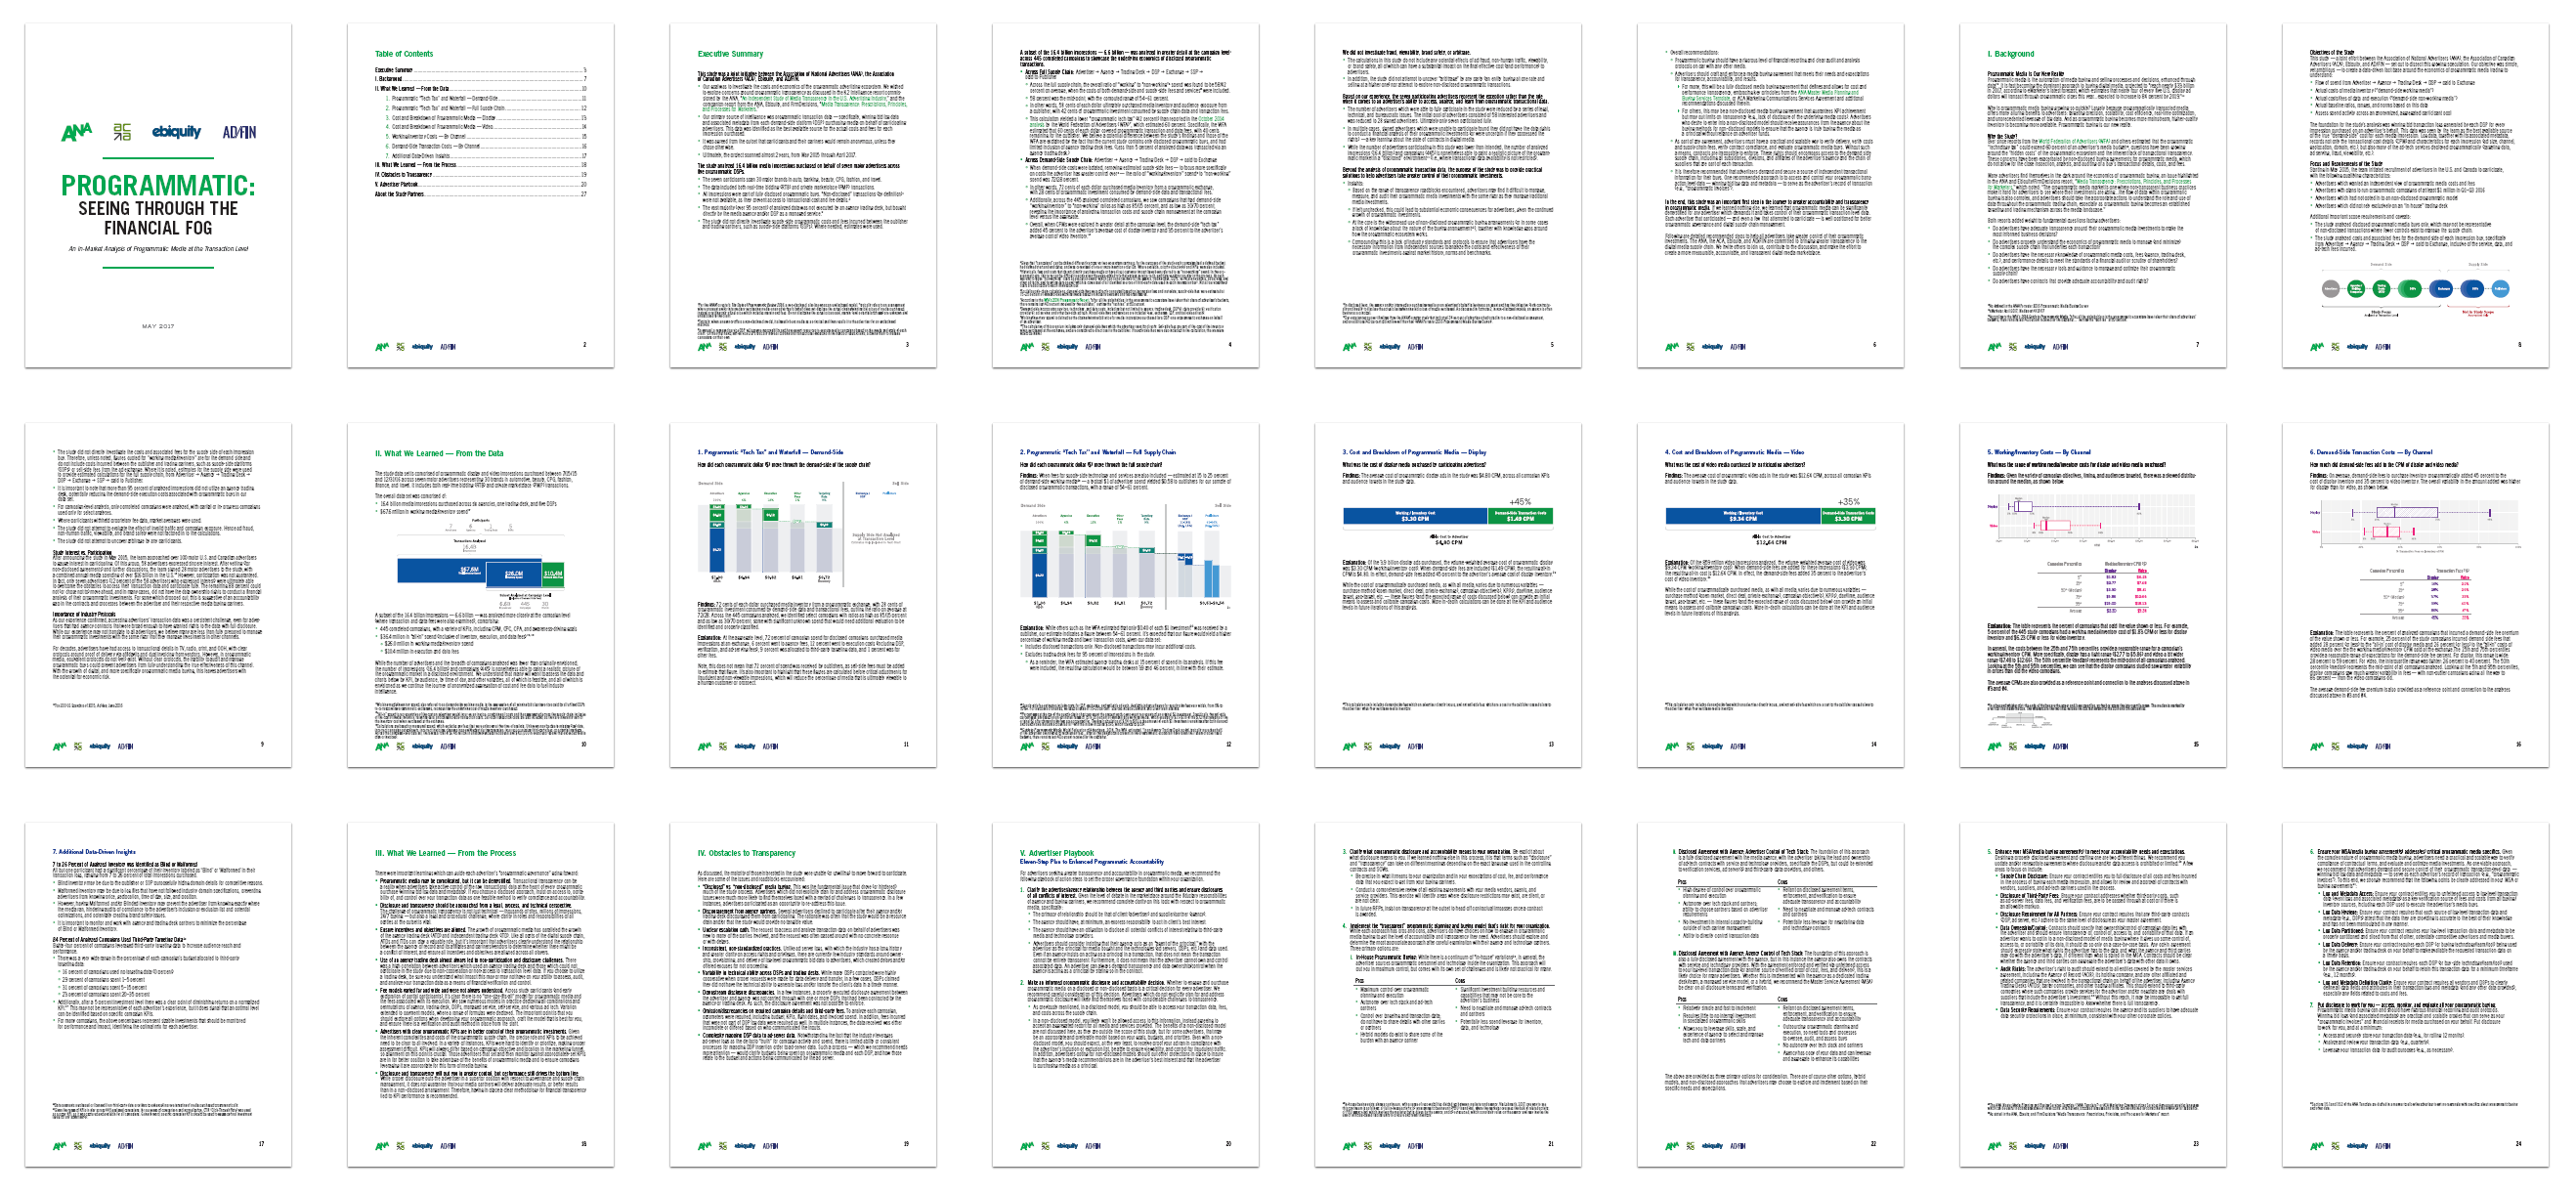
White Paper
We worked with the Association of National Advertisers (ANA) to create a groundbreaking report that shows the amount of money advertisers spent on services besides the publishers.
Skills Applied
- Information Architecture
- Data Visualizations
- Wireframes and Visuals
Team
- Andrew A.
CEO - Ravi P.
Head of Product - Milosz T.
CTO - Du H.
Designer - Timur K.
Front End Engineer - Justin F.
Front End Engineer - Anderson H.
Front End Engineer - Me
Head of Design